905.2 Traffic Studies: Difference between revisions
m →905.2.3 Countermeasure Selection: Per Traffic, removed archaic language |
m Per TS, numerous minor clarifications |
||
| Line 18: | Line 18: | ||
:* transit. | :* transit. | ||
[http://tmshome TMS] has | [http://tmshome TMS] has a highway capacity analysis tool. | ||
===905.2.2 Crash Analysis=== | ===905.2.2 Crash Analysis=== | ||
| Line 24: | Line 24: | ||
A crash analysis is performed for a traffic study to determine whether a safety or operational problem exists. Crash information is obtained during the [[905.1 Traffic Data Collection|data collection]] phase of the traffic study. Crashes are reviewed for severity level of crashes as well as total number of crashes. A high number of crashes having no severe crashes typically indicates a location with high traffic volumes and a potential capacity or operational issue. A location with severe crashes should be reviewed for sight distance, signing, signal timing or other roadway features that may be leading to improper driver behavior. When performing a crash analysis, look for crash patterns that may lead to easily recognizable countermeasures. A collision diagram helps to identify crash patterns. | A crash analysis is performed for a traffic study to determine whether a safety or operational problem exists. Crash information is obtained during the [[905.1 Traffic Data Collection|data collection]] phase of the traffic study. Crashes are reviewed for severity level of crashes as well as total number of crashes. A high number of crashes having no severe crashes typically indicates a location with high traffic volumes and a potential capacity or operational issue. A location with severe crashes should be reviewed for sight distance, signing, signal timing or other roadway features that may be leading to improper driver behavior. When performing a crash analysis, look for crash patterns that may lead to easily recognizable countermeasures. A collision diagram helps to identify crash patterns. | ||
When calculating crash rates during the analysis, compare the calculated rate to the statewide rate. Typically non-intersection studies are compared by roadway type. Comparisons by roadway type are a better indication of a roadway’s safety than comparisons by route designation. For instance, a rural county lettered route functions differently from Rte. D (Page Ave.) in St. Louis County. It is also important to compare routes by urban/rural classifications. For most routes, a crash rate is considered poor when it starts to reach double the statewide average. | When calculating crash rates during the analysis, compare the calculated rate to the statewide rate. Typically, non-intersection studies are compared by roadway type. Comparisons by roadway type are a better indication of a roadway’s safety than comparisons by route designation. For instance, a rural county lettered route functions differently from Rte. D (Page Ave.) in St. Louis County. It is also important to compare routes by urban/rural classifications. For most routes, a crash rate is considered poor when it starts to reach double the statewide average. | ||
{|style="padding: 0.3em; margin-left:7px; border:2px solid #a9a9a9; text-align:center; font-size: 95%; background:#f5f5f5" width="400px" align="right" | {|style="padding: 0.3em; margin-left:7px; border:2px solid #a9a9a9; text-align:center; font-size: 95%; background:#f5f5f5" width="400px" align="right" | ||
|- | |- | ||
| Line 33: | Line 31: | ||
|[http://www.cmfclearinghouse.org/ Crash Modification Factor (CMF) Clearinghouse] presents proven countermeasures, the most important of which show up in the HSM | |[http://www.cmfclearinghouse.org/ Crash Modification Factor (CMF) Clearinghouse] presents proven countermeasures, the most important of which show up in the HSM | ||
|} | |} | ||
The selection of countermeasures is covered in AASHTO's [http://www.highwaysafetymanual.org/ Highway Safety Manual] and [http:// | ===905.2.3 Countermeasure Selection=== | ||
The selection of countermeasures is covered in AASHTO's [http://www.highwaysafetymanual.org/ Highway Safety Manual] and [http://www.trb.org/Main/Blurbs/152868.aspx NCHRP 500 series]. Both of these documents should be used as reference tools only. Any information contained in these documents is considered secondary to the EPG. Both of these guides start with identified problems and use charts to match potential solutions to the identified problems. These charts are comprehensive but are not the only solutions possible. | |||
[[image:905.4.4.jpg|right|300px]] | [[image:905.4.4.jpg|right|300px]] | ||
| Line 45: | Line 45: | ||
:* Legibility, especially the size and font of lettering | :* Legibility, especially the size and font of lettering | ||
:* Perception-reaction time | :* Perception-reaction time | ||
:* Driver overload, that is, | :* Driver overload, that is, too much information too quickly for a driver to reasonably understand | ||
:* The number of lines of legend | :* The number of lines of legend | ||
:* Advance placement of signing/delineation | :* Advance placement of signing/delineation | ||
| Line 71: | Line 71: | ||
===905.2.9 Traffic Control in School Areas=== | ===905.2.9 Traffic Control in School Areas=== | ||
When reviewing traffic control in school areas, refer to [[902.11 Traffic Control for Schools|EPG 902.11 Traffic Control for Schools]]. Another source of information involving traffic and pedestrian operations in school areas is the manual | When reviewing traffic control in school areas, refer to [[902.11 Traffic Control for Schools|EPG 902.11 Traffic Control for Schools]]. Another source of information involving traffic and pedestrian operations in school areas is the manual ''School Transportation & Traffic Safety – Guidebook for Local Agencies'' that was published for local agencies in 1996 using TTAP funds. Any information from the guidebook is secondary to the EPG. | ||
===905.2.10 Pedestrian and Bicycle Facilities=== | ===905.2.10 Pedestrian and Bicycle Facilities=== | ||
| Line 82: | Line 82: | ||
|[[image:905.4.11.1.jpg|right|140px]]||[[image:905.4.11.2.jpg|right|140px]]||[[image:905.4.11.3.jpg|right|140px]] | |[[image:905.4.11.1.jpg|right|140px]]||[[image:905.4.11.2.jpg|right|140px]]||[[image:905.4.11.3.jpg|right|140px]] | ||
|} | |} | ||
Law enforcement at a location can reduce the number and severity of crashes, provide orderly flow of traffic and detect offenders of traffic violations. When considering law enforcement as a countermeasure, several options are available including contacting [http://wwwi/intranet/hs/ Highway Safety] or the regional Blueprint representative, the local law enforcement agency direct or consider automated enforcement options. Crashes that do not have a direct engineering solution should not be disregarded. [http:// | Law enforcement at a location can reduce the number and severity of crashes, provide orderly flow of traffic and detect offenders of traffic violations. When considering law enforcement as a countermeasure, several options are available including contacting [http://wwwi/intranet/hs/ Highway Safety and Traffic] or the regional [https://www.savemolives.com/mcrs Blueprint] representative, the local law enforcement agency direct or consider automated enforcement options. Crashes that do not have a direct engineering solution should not be disregarded. [http://sp/sites/ts/Pages/default.aspx Highway Safety and Traffic] provides law enforcement agencies contracts to enforce hazardous moving violations and driving under the influence of alcohol violations. Law enforcement should also be considered for work zones. Refer to [[616.16 Law Enforcement Services|EPG 616.16 Law Enforcement Services]] when considering law enforcement in work zones. | ||
===905.2.12 Traffic Calming=== | ===905.2.12 Traffic Calming=== | ||
| Line 102: | Line 102: | ||
:* relocation of problems | :* relocation of problems | ||
:* noise | :* noise | ||
:* | :* crash rates and | ||
:* enforcement. | :* enforcement. | ||
Revision as of 11:19, 14 October 2020
905.2.1 Highway Capacity Analysis
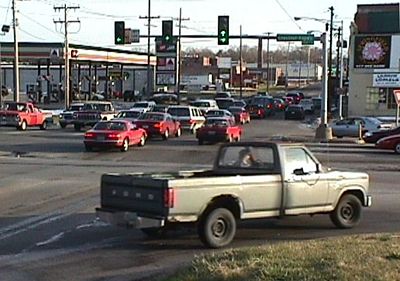
According to the Highway Capacity Manual (HCM), the capacity of a facility is the maximum hourly rate that persons or vehicles can reasonably be expected to traverse a point or uniform section of a lane or roadway during a given time period under prevailing roadway, traffic and control conditions. The HCM provides methodologies for calculating capacity for
- urban streets
- signalized intersections
- unsignalized intersections
- pedestrians
- bicycles
- two-lane highways
- multilane highways
- freeway facilities
- basic freeway segments
- freeway weaving
- ramps and ramp junctions
- interchange ramp terminals and
- transit.
TMS has a highway capacity analysis tool.
905.2.2 Crash Analysis
A crash analysis is performed for a traffic study to determine whether a safety or operational problem exists. Crash information is obtained during the data collection phase of the traffic study. Crashes are reviewed for severity level of crashes as well as total number of crashes. A high number of crashes having no severe crashes typically indicates a location with high traffic volumes and a potential capacity or operational issue. A location with severe crashes should be reviewed for sight distance, signing, signal timing or other roadway features that may be leading to improper driver behavior. When performing a crash analysis, look for crash patterns that may lead to easily recognizable countermeasures. A collision diagram helps to identify crash patterns.
When calculating crash rates during the analysis, compare the calculated rate to the statewide rate. Typically, non-intersection studies are compared by roadway type. Comparisons by roadway type are a better indication of a roadway’s safety than comparisons by route designation. For instance, a rural county lettered route functions differently from Rte. D (Page Ave.) in St. Louis County. It is also important to compare routes by urban/rural classifications. For most routes, a crash rate is considered poor when it starts to reach double the statewide average.
| Additional Information |
| Crash Modification Factor (CMF) Clearinghouse presents proven countermeasures, the most important of which show up in the HSM |
905.2.3 Countermeasure Selection
The selection of countermeasures is covered in AASHTO's Highway Safety Manual and NCHRP 500 series. Both of these documents should be used as reference tools only. Any information contained in these documents is considered secondary to the EPG. Both of these guides start with identified problems and use charts to match potential solutions to the identified problems. These charts are comprehensive but are not the only solutions possible.
905.2.4 Human Factors of Roadway Safety
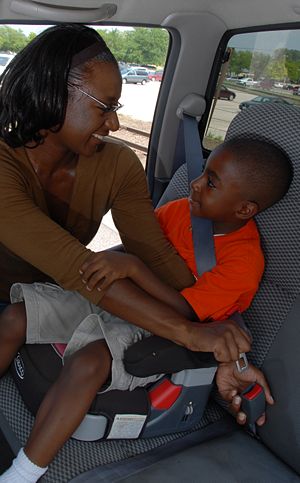
Human factors should be considered when conducting a traffic study. Keep in mind the following factors of the traveler:
- Age, that is the needs of older or younger drivers
- Cone of vision
- Placement of traffic control devices
- Legibility, especially the size and font of lettering
- Perception-reaction time
- Driver overload, that is, too much information too quickly for a driver to reasonably understand
- The number of lines of legend
- Advance placement of signing/delineation
- Sign spacing
- Effect of colors
- Device visibility and
- Driver expectations.
905.2.5 Highway Signing
When reviewing highway signing, refer to EPG 903 Highway Signing.
905.2.6 Temporary Traffic Control Devices
When reviewing temporary traffic control devices, refer to EPG 616 Temporary Traffic Control.
905.2.7 Pavement Marking
When reviewing pavement marking, refer to EPG 620 Pavement Marking.
905.2.8 Traffic Signals
When reviewing traffic signals, refer to EPG 902 Signals.
905.2.9 Traffic Control in School Areas
When reviewing traffic control in school areas, refer to EPG 902.11 Traffic Control for Schools. Another source of information involving traffic and pedestrian operations in school areas is the manual School Transportation & Traffic Safety – Guidebook for Local Agencies that was published for local agencies in 1996 using TTAP funds. Any information from the guidebook is secondary to the EPG.
905.2.10 Pedestrian and Bicycle Facilities
Pedestrian and bicycle facilities should be considered on every project. When reviewing pedestrian facilities, refer to EPG 642 Pedestrian Facilities and EPG 641 Bicycle Facilities when reviewing bicycle use and facilities.
905.2.11 Law Enforcement
 |
 |
 |
Law enforcement at a location can reduce the number and severity of crashes, provide orderly flow of traffic and detect offenders of traffic violations. When considering law enforcement as a countermeasure, several options are available including contacting Highway Safety and Traffic or the regional Blueprint representative, the local law enforcement agency direct or consider automated enforcement options. Crashes that do not have a direct engineering solution should not be disregarded. Highway Safety and Traffic provides law enforcement agencies contracts to enforce hazardous moving violations and driving under the influence of alcohol violations. Law enforcement should also be considered for work zones. Refer to EPG 616.16 Law Enforcement Services when considering law enforcement in work zones.
905.2.12 Traffic Calming
When drivers are not behaving as intended on a route, traffic calming solutions should be considered. The Traffic Safety Toolbox, ITE publication, 1999 edition states, “Traffic calming is the combination of mainly physical measures that reduce the negative impacts of motor vehicle use, alter driver behavior and improve conditions for non-motorized street users.” Techniques to consider for traffic calming include:
- road closures and diverters
- horizontal deflections and
- vertical deflections.
Other considerations when reviewing options for traffic calming include
- maintenance
- public perception
- emergency response
- spacing of calming devices
- residents’ mobility
- effects to pedestrians/bicyclists
- relocation of problems
- noise
- crash rates and
- enforcement.