905.2 Traffic Studies: Difference between revisions
m Per TS, updated text to current verbiage by changing "accidents" to "crashes", "SWAR" changed to "SWCR" and "AR" to "CR". |
|||
| (One intermediate revision by the same user not shown) | |||
| Line 82: | Line 82: | ||
|[[image:905.4.11.1.jpg|right|140px]]||[[image:905.4.11.2.jpg|right|140px]]||[[image:905.4.11.3.jpg|right|140px]] | |[[image:905.4.11.1.jpg|right|140px]]||[[image:905.4.11.2.jpg|right|140px]]||[[image:905.4.11.3.jpg|right|140px]] | ||
|} | |} | ||
Law enforcement at a location can reduce the number and severity of crashes, provide orderly flow of traffic and detect offenders of traffic violations. When considering law enforcement as a countermeasure, several options are available including contacting [http:// | Law enforcement at a location can reduce the number and severity of crashes, provide orderly flow of traffic and detect offenders of traffic violations. When considering law enforcement as a countermeasure, several options are available including contacting [http://sp/sites/ts/Pages/default.aspx Highway Safety and Traffic] or the regional [https://www.savemolives.com/mcrs Blueprint] representative, the local law enforcement agency direct or consider automated enforcement options. Crashes that do not have a direct engineering solution should not be disregarded. [http://sp/sites/ts/Pages/default.aspx Highway Safety and Traffic] provides law enforcement agencies contracts to enforce hazardous moving violations and driving under the influence of alcohol violations. Law enforcement should also be considered for work zones. Refer to [[616.16 Law Enforcement Services|EPG 616.16 Law Enforcement Services]] when considering law enforcement in work zones. | ||
===905.2.12 Traffic Calming=== | ===905.2.12 Traffic Calming=== | ||
| Line 209: | Line 209: | ||
=====905.2.14.2.1 Fatality and Disabling Injury Crash Rate===== | =====905.2.14.2.1 Fatality and Disabling Injury Crash Rate===== | ||
If either the fatal or disabling injury crash rates, based on reportable | If either the fatal or disabling injury crash rates, based on reportable crashes within the proposed area, are 50% higher than the statewide average crash rate for the same roadway type, prevailing speed may be reduced by 5%. | ||
If the fatal or disabling crash rate is more than twice the statewide rate for the roadway type, the prevailing speed may be reduced by 10%. | If the fatal or disabling crash rate is more than twice the statewide rate for the roadway type, the prevailing speed may be reduced by 10%. | ||
| Line 224: | Line 224: | ||
=====905.2.14.2.2 Total Crash Rate===== | =====905.2.14.2.2 Total Crash Rate===== | ||
If the overall crash rate, based on reportable | If the overall crash rate, based on reportable crashes within the proposed area, is 50% higher than the statewide average crash rate for the same roadway type, prevailing speed may be reduced by 5%. | ||
If the crash rate is more than twice the statewide rate for the roadway type, the prevailing speed may be reduced by 10%. | If the crash rate is more than twice the statewide rate for the roadway type, the prevailing speed may be reduced by 10%. | ||
| Line 248: | Line 248: | ||
Where significant adjacent development includes residential and commercial access points, the prevailing speed may be reduced to account for driveway conflicts. If necessary, this effect on the prevailing speed may be determined as outlined below. | Where significant adjacent development includes residential and commercial access points, the prevailing speed may be reduced to account for driveway conflicts. If necessary, this effect on the prevailing speed may be determined as outlined below. | ||
The effect of driveway entrances can be determined by using a Driveway Conflict Number. For this purpose, a private or field entrance should have a Driveway Conflict Number of 1. Minor commercial entrances should have a number of 5. Major commercial entrances, shopping centers or industrial plant entrances that generate relatively high volumes of traffic, and public streets should have a number of 10. If the total Driveway Conflict Number exceeds a rate of 40 per mile through the proposed zone, the prevailing speed may be reduced by 5 percent. If the total number exceeds a rate of 60 per mile, the prevailing speed may be reduced by 10 percent. However, before a reduction is made due to the Driveway Conflict Number, the Poisson Curve should be used to determine if the | The effect of driveway entrances can be determined by using a Driveway Conflict Number. For this purpose, a private or field entrance should have a Driveway Conflict Number of 1. Minor commercial entrances should have a number of 5. Major commercial entrances, shopping centers or industrial plant entrances that generate relatively high volumes of traffic, and public streets should have a number of 10. If the total Driveway Conflict Number exceeds a rate of 40 per mile through the proposed zone, the prevailing speed may be reduced by 5 percent. If the total number exceeds a rate of 60 per mile, the prevailing speed may be reduced by 10 percent. However, before a reduction is made due to the Driveway Conflict Number, the Poisson Curve should be used to determine if the crash reduction is statistically significant. | ||
[[image: | [[image:905.2.14.2.5.jpg|center|550px|thumb|<center>'''Figure 905.2.14.2.5'''</center>]] | ||
The test is as follows: | The test is as follows: | ||
a) Consult Fig. 905.2.14.2.5, using the current number of | a) Consult Fig. 905.2.14.2.5, using the current number of crashes for the last year. | ||
b) Determine the graph’s percent value from the Poisson Curve. | b) Determine the graph’s percent value from the Poisson Curve. | ||
c) Compute | c) Compute crash rate for last year. | ||
::<math>\mbox{ | ::<math>\mbox{Crash Rate}=\frac{\mbox{no. of crashes x 100,000,000}} | ||
{\mbox{365 x ADT x length in miles}}</math> | {\mbox{365 x ADT x length in miles}}</math> | ||
d) Obtain Statewide | d) Obtain Statewide Crash Rate (SWCR). The crash data is obtained from the [http://tms/home/ Transportation Management System (TMS)]. | ||
e) Calculate percent reduction between | e) Calculate percent reduction between crash rate and statewide crash rate by: | ||
::<math>\mbox{Percent Reduction}={100}\frac{\mbox{ | ::<math>\mbox{Percent Reduction}={100}\frac{\mbox{CR-SWCR}} | ||
{\mbox{ | {\mbox{CR}}</math> | ||
f) Compare % reduction with value obtained in step b. | f) Compare % reduction with value obtained in step b. | ||
| Line 276: | Line 276: | ||
'''Example:''' | '''Example:''' | ||
:8.0-mile section of roadway, AADT = 3,100, 30 | :8.0-mile section of roadway, AADT = 3,100, 30 crashes within last year. | ||
:a & b). Value obtained from Fig. 905.2.14.2 = 30 % | :a & b). Value obtained from Fig. 905.2.14.2 = 30 % | ||
:c).<math>\mbox{ | :c).<math>\mbox{CR}=\mbox{331.4}=\frac{\mbox{30(100,000,000)}} | ||
{\mbox{(365)(3,100)(8.0)}}</math> | {\mbox{(365)(3,100)(8.0)}}</math> | ||
:d). | :d). SWCR = 242.04 | ||
:e).<math>\mbox{26.9 percent reduction}={100}\frac{\mbox{331.4-242.04}} | :e).<math>\mbox{26.9 percent reduction}={100}\frac{\mbox{331.4-242.04}} | ||
| Line 306: | Line 306: | ||
====905.2.14.3 Additional Guidelines for Establishing Speed Limits==== | ====905.2.14.3 Additional Guidelines for Establishing Speed Limits==== | ||
Normally, isolated curves and turns, areas of restricted sight distance, no passing zones, etc. will not be considered as areas for lowering speed limits. The | Normally, isolated curves and turns, areas of restricted sight distance, no passing zones, etc. will not be considered as areas for lowering speed limits. The crash record on such highways will be the principle criterion. Advisory speed signs shall be used in connection with the appropriate warning signs at these locations. | ||
Except on divided highways, different speeds for traffic in opposite directions cannot be justified. | Except on divided highways, different speeds for traffic in opposite directions cannot be justified. | ||
Latest revision as of 08:22, 13 April 2022
905.2.1 Highway Capacity Analysis
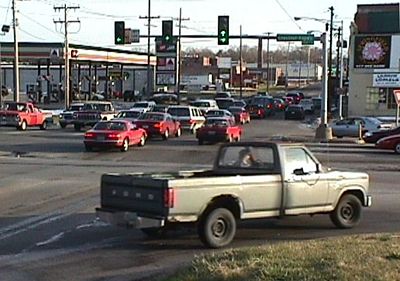
According to the Highway Capacity Manual (HCM), the capacity of a facility is the maximum hourly rate that persons or vehicles can reasonably be expected to traverse a point or uniform section of a lane or roadway during a given time period under prevailing roadway, traffic and control conditions. The HCM provides methodologies for calculating capacity for
- urban streets
- signalized intersections
- unsignalized intersections
- pedestrians
- bicycles
- two-lane highways
- multilane highways
- freeway facilities
- basic freeway segments
- freeway weaving
- ramps and ramp junctions
- interchange ramp terminals and
- transit.
TMS has a highway capacity analysis tool.
905.2.2 Crash Analysis
A crash analysis is performed for a traffic study to determine whether a safety or operational problem exists. Crash information is obtained during the data collection phase of the traffic study. Crashes are reviewed for severity level of crashes as well as total number of crashes. A high number of crashes having no severe crashes typically indicates a location with high traffic volumes and a potential capacity or operational issue. A location with severe crashes should be reviewed for sight distance, signing, signal timing or other roadway features that may be leading to improper driver behavior. When performing a crash analysis, look for crash patterns that may lead to easily recognizable countermeasures. A collision diagram helps to identify crash patterns.
When calculating crash rates during the analysis, compare the calculated rate to the statewide rate. Typically, non-intersection studies are compared by roadway type. Comparisons by roadway type are a better indication of a roadway’s safety than comparisons by route designation. For instance, a rural county lettered route functions differently from Rte. D (Page Ave.) in St. Louis County. It is also important to compare routes by urban/rural classifications. For most routes, a crash rate is considered poor when it starts to reach double the statewide average.
| Additional Information |
| Crash Modification Factor (CMF) Clearinghouse presents proven countermeasures, the most important of which show up in the HSM |
905.2.3 Countermeasure Selection
The selection of countermeasures is covered in AASHTO's Highway Safety Manual and NCHRP 500 series. Both of these documents should be used as reference tools only. Any information contained in these documents is considered secondary to the EPG. Both of these guides start with identified problems and use charts to match potential solutions to the identified problems. These charts are comprehensive but are not the only solutions possible.
905.2.4 Human Factors of Roadway Safety
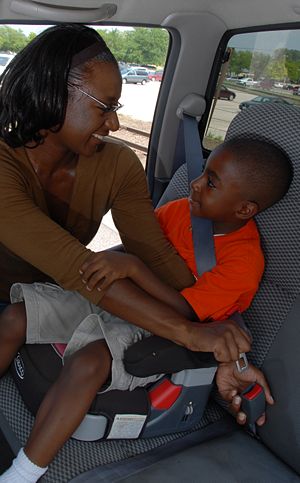
Human factors should be considered when conducting a traffic study. Keep in mind the following factors of the traveler:
- Age, that is the needs of older or younger drivers
- Cone of vision
- Placement of traffic control devices
- Legibility, especially the size and font of lettering
- Perception-reaction time
- Driver overload, that is, too much information too quickly for a driver to reasonably understand
- The number of lines of legend
- Advance placement of signing/delineation
- Sign spacing
- Effect of colors
- Device visibility and
- Driver expectations.
905.2.5 Highway Signing
When reviewing highway signing, refer to EPG 903 Highway Signing.
905.2.6 Temporary Traffic Control Devices
When reviewing temporary traffic control devices, refer to EPG 616 Temporary Traffic Control.
905.2.7 Pavement Marking
When reviewing pavement marking, refer to EPG 620 Pavement Marking.
905.2.8 Traffic Signals
When reviewing traffic signals, refer to EPG 902 Signals.
905.2.9 Traffic Control in School Areas
When reviewing traffic control in school areas, refer to EPG 902.11 Traffic Control for Schools. Another source of information involving traffic and pedestrian operations in school areas is the manual School Transportation & Traffic Safety – Guidebook for Local Agencies that was published for local agencies in 1996 using TTAP funds. Any information from the guidebook is secondary to the EPG.
905.2.10 Pedestrian and Bicycle Facilities
Pedestrian and bicycle facilities should be considered on every project. When reviewing pedestrian facilities, refer to EPG 642 Pedestrian Facilities and EPG 641 Bicycle Facilities when reviewing bicycle use and facilities.
905.2.11 Law Enforcement
 |
 |
 |
Law enforcement at a location can reduce the number and severity of crashes, provide orderly flow of traffic and detect offenders of traffic violations. When considering law enforcement as a countermeasure, several options are available including contacting Highway Safety and Traffic or the regional Blueprint representative, the local law enforcement agency direct or consider automated enforcement options. Crashes that do not have a direct engineering solution should not be disregarded. Highway Safety and Traffic provides law enforcement agencies contracts to enforce hazardous moving violations and driving under the influence of alcohol violations. Law enforcement should also be considered for work zones. Refer to EPG 616.16 Law Enforcement Services when considering law enforcement in work zones.
905.2.12 Traffic Calming
When drivers are not behaving as intended on a route, traffic calming solutions should be considered. The Traffic Safety Toolbox, ITE publication, 1999 edition states, “Traffic calming is the combination of mainly physical measures that reduce the negative impacts of motor vehicle use, alter driver behavior and improve conditions for non-motorized street users.” Techniques to consider for traffic calming include:
- road closures and diverters
- horizontal deflections and
- vertical deflections.
Other considerations when reviewing options for traffic calming include
- maintenance
- public perception
- emergency response
- spacing of calming devices
- residents’ mobility
- effects to pedestrians/bicyclists
- relocation of problems
- noise
- crash rates and
- enforcement.
905.2.13 Voiding City Ordinances on State Routes with Inappropriate Speed Limits
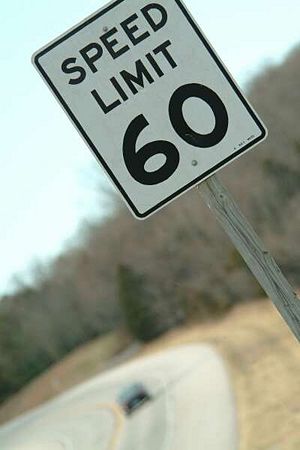
Missouri Revised Statute 304.010 contains the state laws pertaining to speed limits on Missouri’s roadways. Paragraphs 3 and 4 address speed limits on state routes and state:
- 3. On any state road or highway where the speed limit is not set pursuant to a local ordinance, the highways and transportation commission may set a speed limit higher or lower than the uniform maximum speed limit provided in subsection 2 of this section, if a higher or lower speed limit is recommended by the department of transportation. The department of public safety, where it believes for safety reasons, or to expedite the flow of traffic a higher or lower speed limit is warranted, may request the department of transportation to raise or lower such speed limit, except that no speed limit shall be set higher than seventy miles per hour.
- 4. Notwithstanding the provisions of section 304.120 or any other provision of law to the contrary, cities, towns and villages may regulate the speed of vehicles on state roads and highways within such cities', towns' or villages' corporate limits by ordinance with the approval of the state highways and transportation commission. Any reduction of speed in cities, towns or villages shall be designed to expedite the flow of traffic on such state roads and highways to the extent consistent with public safety. The commission may declare any ordinance void if it finds that such ordinance is:
- (1) Not primarily designed to expedite traffic flow; and
- (2) Primarily designed to produce revenue for the city, town or village which enacted such ordinance.
- If an ordinance is declared void, the city, town or village shall have any future proposed ordinance approved by the highways and transportation commission before such ordinance may take effect.
If a District Engineer believes that a city, village or town has passed an ordinance establishing an inappropriate speed limit, the District Engineer shall ensure the following actions are taken:
- 1. Advise the city that a study will be made to determine the appropriate speed limit in the area.
- 2. If a speed limit ordinance is found to be inappropriate as determined by a traffic engineering study and is determined to be for the purpose of producing revenue, a letter shall be sent to the city advising that their speed limit appears inappropriate and request a meeting with the city to discuss the matter.
- 3. If a consensus cannot be obtained between the department and the city, the city would be notified of the date that the department’s recommendation will be presented to the Missouri Highways and Transportation Commission.
- 4. If the Commission determines that the city speed limit is not correct as presently posted, the city shall be asked to adjust to the proper speed limit as determined by the Commission. If the city does not comply, the city speed limit ordinance will be declared void and posted as determined by the Commission.
- 5. The city will then be notified of the Commission action and advised that all enforcement must be adjudicated through state courts unless the city passes and ordinance specifying the speed limit is the same as has been posted.
905.2.14 Speed Limit Guidelines
| Traffic Pamphlet | |
| Speed Limits | |
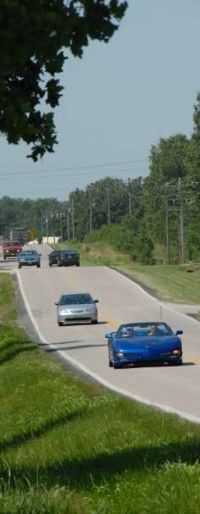
The following guidelines promote consistency of speed limit postings on the state of Missouri’s highway system. In all cases, engineering judgment is necessary to determine the most appropriate speed limit at a location.
905.2.14.1 Maximum Speed Limits
Maximum speed limits in Missouri are governed by the Missouri Revised Statutes, Section 304.010. The following table summarizes maximum speed limits as established by the statutes:
| Rural Areas | |
|---|---|
| 70 mph | Interstate and Freeways |
| 65 mph | Expressways |
| 55 mph | State Lettered Routes 1 |
| 60 mph | All other roadways, not urbanized |
| Urbanized Areas | |
| 60 mph | Interstate, Freeways and Expressways |
| 55 mph | State Lettered Routes 1 |
| 1 May be up to 60 mph based on engineering judgement | |
- At no time shall any Missouri road be posted above 70 mph.
- “…the Highways and Transportation Commission may set a speed limit higher or lower than the uniform maximum speed limit…if a higher or lower speed limit is recommended by the Department of Transportation.”
905.2.14.1.1 Definitions (per MRS 304.010)
Freeway: A limited access divided highway of at least ten miles in length with four or more lanes that is not part of the federal interstate system of highways and does not have any crossovers or accesses from streets, roads or other highways at the same grade level as such divided highway within such ten miles of divided highway;
Expressway: A divided highway of at least 10 miles long with 4 or more lanes that is not part of the federal interstate system of highways and has crossovers or accesses from streets, roads or other highways at the same grade level as such divided highway;
905.2.14.1.2 Discrepancies
Before raising a posted speed limit above the maximums in the state statute, the district should notify the State Traffic Engineer.
Districts should coordinate across district borders to ensure consistent posted speed limits on inter-district routes in accordance with the speed limit guidelines.
905.2.14.1.3 Length of Section
Any speed limit section should have a logical beginning and ending point. Examples include city limits, roadway type changes, etc. Additionally, speed limits in unincorporated or “non-community” areas should stay consistent for a minimum of 2 miles.
905.2.14.2 Prevailing Speed Determination
Prevailing speed determination is the starting point to setting speed limits in incorporated and unincorporated areas, pursuant to the aforementioned state statutes. The prevailing speed of free-flowing traffic shall be determined using one or more of the three criteria below:
- 85th percentile speed;
- Upper limit of the 10 mph pace;
- Average test run speed.
The selected speed limit (in 5 mph increments) should not exceed the established prevailing speed by more than 3 mph.
The following factors may allow for reduction of the prevailing speed. The prevailing speed shall not be reduced below the 50th percentile (average) speed using these factors.
- 1. Fatality and Disabling Injury Crash Rate
- 2. Total Crash Rate
- 3. Pedestrian Traffic
- 4. Parking
- 5. Adjacent Development
- 6. Physical Roadway Conditions
905.2.14.2.1 Fatality and Disabling Injury Crash Rate
If either the fatal or disabling injury crash rates, based on reportable crashes within the proposed area, are 50% higher than the statewide average crash rate for the same roadway type, prevailing speed may be reduced by 5%.
If the fatal or disabling crash rate is more than twice the statewide rate for the roadway type, the prevailing speed may be reduced by 10%.
Table 905.2.14.2.1 Prevailing Speed Reduction for Severe Crash Rates
| Reduction Condition | Prevailing Speed Reduction |
|---|---|
| Fatal or Disabling Injury Crash Rate > 1.5 SWAR | 5% |
| Fatal or Disabling Injury Crash Rate > 2.0 SWAR | 10% |
905.2.14.2.2 Total Crash Rate
If the overall crash rate, based on reportable crashes within the proposed area, is 50% higher than the statewide average crash rate for the same roadway type, prevailing speed may be reduced by 5%.
If the crash rate is more than twice the statewide rate for the roadway type, the prevailing speed may be reduced by 10%.
Table 905.2.14.2.2 Prevailing Speed Reduction for Total Crash Rates
| Reduction Condition | Prevailing Speed Reduction |
|---|---|
| Total Crash Rate > 1.5 SWAR | 5% |
| Total Crash Rate > 2.0 SWAR | 10% |
905.2.14.2.3 Pedestrian Traffic
Where sidewalks are not provided adjacent to the route and a total pedestrian traffic along the route exceeds 10 per hour for 3 hours of any 8-hour period, the prevailing speed may be reduced by 5 percent. Pedestrians crossing the route may only be counted if the point of crossing is not protected by a traffic control device.
905.2.14.2.4 Parking
Where parking is permitted adjacent to the traffic lane, the prevailing speed may be reduced by 5 percent.
905.2.14.2.5 Adjacent Development
Where significant adjacent development includes residential and commercial access points, the prevailing speed may be reduced to account for driveway conflicts. If necessary, this effect on the prevailing speed may be determined as outlined below.
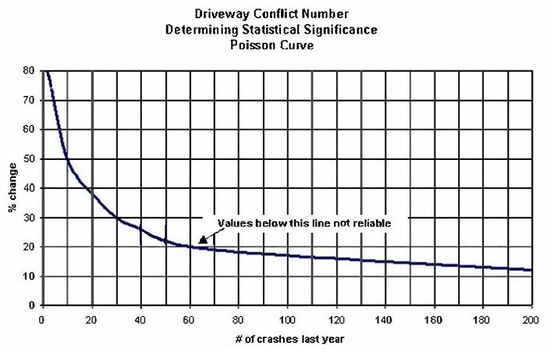
The effect of driveway entrances can be determined by using a Driveway Conflict Number. For this purpose, a private or field entrance should have a Driveway Conflict Number of 1. Minor commercial entrances should have a number of 5. Major commercial entrances, shopping centers or industrial plant entrances that generate relatively high volumes of traffic, and public streets should have a number of 10. If the total Driveway Conflict Number exceeds a rate of 40 per mile through the proposed zone, the prevailing speed may be reduced by 5 percent. If the total number exceeds a rate of 60 per mile, the prevailing speed may be reduced by 10 percent. However, before a reduction is made due to the Driveway Conflict Number, the Poisson Curve should be used to determine if the crash reduction is statistically significant.
The test is as follows:
a) Consult Fig. 905.2.14.2.5, using the current number of crashes for the last year.
b) Determine the graph’s percent value from the Poisson Curve.
c) Compute crash rate for last year.
d) Obtain Statewide Crash Rate (SWCR). The crash data is obtained from the Transportation Management System (TMS).
e) Calculate percent reduction between crash rate and statewide crash rate by:
f) Compare % reduction with value obtained in step b.
g) If % reduction equals or exceeds value obtained in step b, the Driveway Conflict Number may be used as the action would be statistically significant.
Example:
- 8.0-mile section of roadway, AADT = 3,100, 30 crashes within last year.
- a & b). Value obtained from Fig. 905.2.14.2 = 30 %
- c).
- d). SWCR = 242.04
- e).
- f). Compare % reduction with value.
- 26.9 < 30
- Since 26.9 is less than 30, the Driveway Conflict Number cannot be considered.
905.2.14.2.6 Procedures for Obtaining Prevailing Speed Data
Spot speed studies can be made with any speed measurement device such as radar, count cards and inductive loops that determine the 85th percentile speed and the upper limit of the 10 mph pace. The 85th percentile speed is defined as the speed at or below which 85 percent of the vehicles are traveling. The 10 mph pace is defined as the 10 mph range containing the most vehicles.
Spot speed studies should be made as close to the center of the proposed zone as is practical. If the zone is lengthier than one mile, studies should be made at a minimum of two locations. If the difference in data between the two locations is minor, the higher value should be used. If the difference in data is over 5 mph, consideration should be given to designating separate zones.
Exercise care to collect the data in a manner and at times that indicate normal conditions. Normal conditions will be assumed to prevail under good weather conditions on dry pavement, following morning rush hours and prior to the evening rush hours, on any day of the week except Saturdays, Sundays or holidays. Observations should not be made immediately following a significant event or during a period of greater than normal police enforcement. Every effort should be made to disguise or conceal the fact that speeds are being reported.
Speeds should be observed for at least 100 passenger cars and pick-up trucks. Trucks over 4 tons will not be included in the data for determining a revised limit.
Average test run speeds shall be determined on the basis of at least two runs in each direction over the length of the proposed zone. The prime consideration in these test runs is to determine a maximum permissible speed. Speeds are to be recorded at 0.1 mile intervals. While making the test run, the driver will try to “float” in the traffic stream, passing as many vehicles as pass the test car.
905.2.14.3 Additional Guidelines for Establishing Speed Limits
Normally, isolated curves and turns, areas of restricted sight distance, no passing zones, etc. will not be considered as areas for lowering speed limits. The crash record on such highways will be the principle criterion. Advisory speed signs shall be used in connection with the appropriate warning signs at these locations.
Except on divided highways, different speeds for traffic in opposite directions cannot be justified.
Speed limits shall begin at a point on or as near in advanced of the point as possible where the speed limit is warranted and shall end at the point or as near the point as possible where the speed limit is not warranted.